Flow charts are one visual tool we can use to visualize any algorithm using a special set of illustrations.
Every flow chart has a beginning, and an end. An arrow determines the direction of the flow:
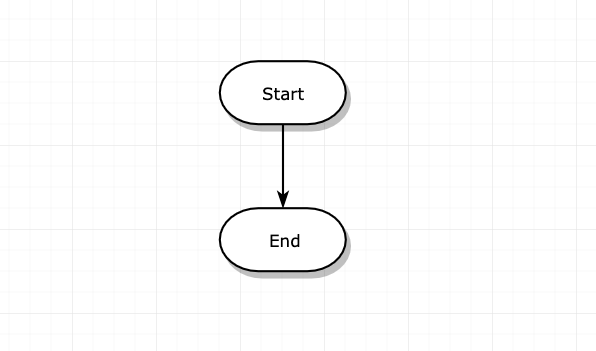
I use draw.io to make those graphs, but you can use whatever other tool you like.
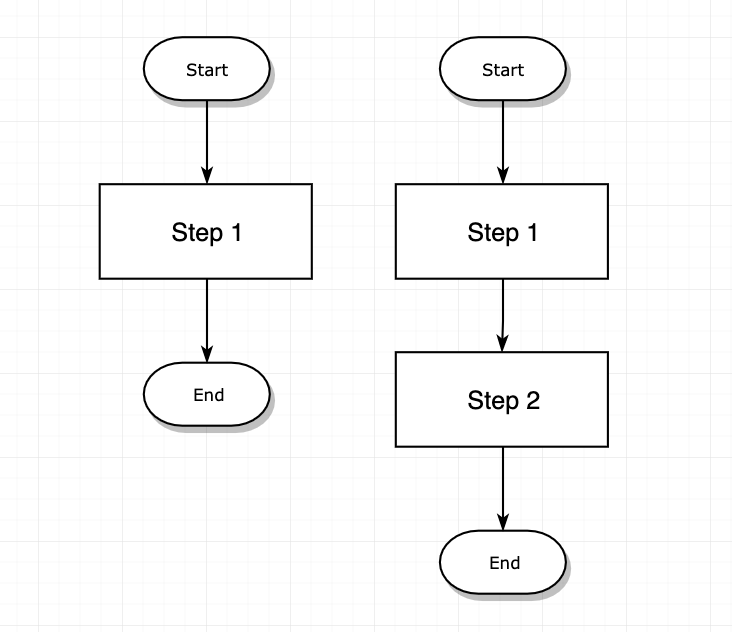
In the middle, that’s where the magic happens.
We identify each step of the sequence with a squared box:
Every time you are facing a choice, a diamond box contains a question, and can point to a different flow depending on the answer. Once the 2 roads can meet again, we add a circle:
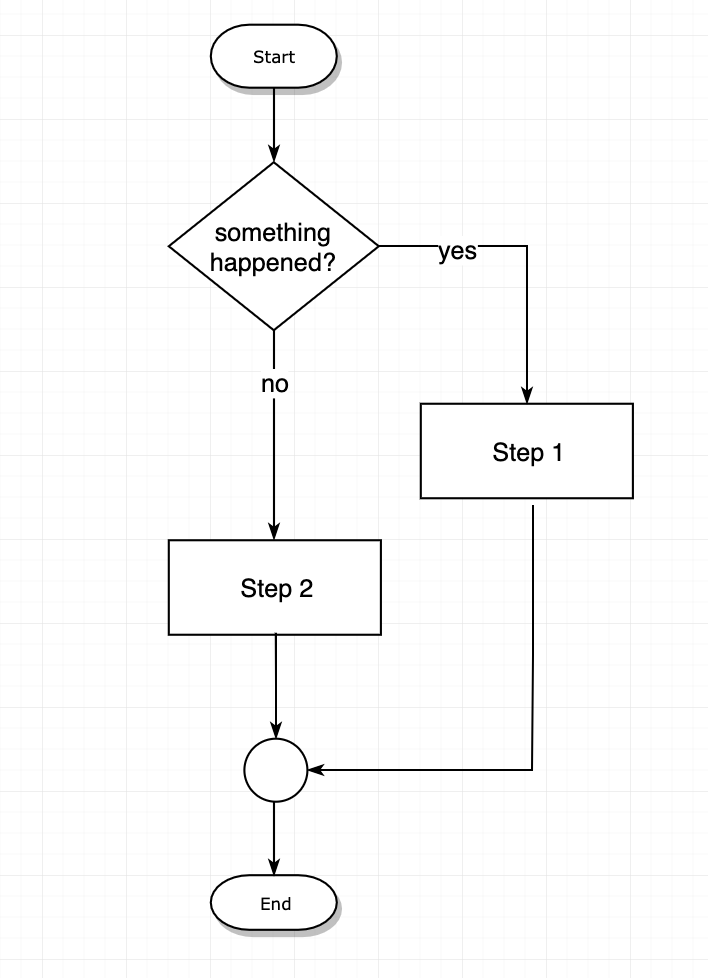
That’s basically it. You can use other symbols to identify special things happening, like I/O with parallelograms, but it’s not an essential part of it.
In the next lessons we’ll see 3 practical examples of using flow charts to describe algorithms.